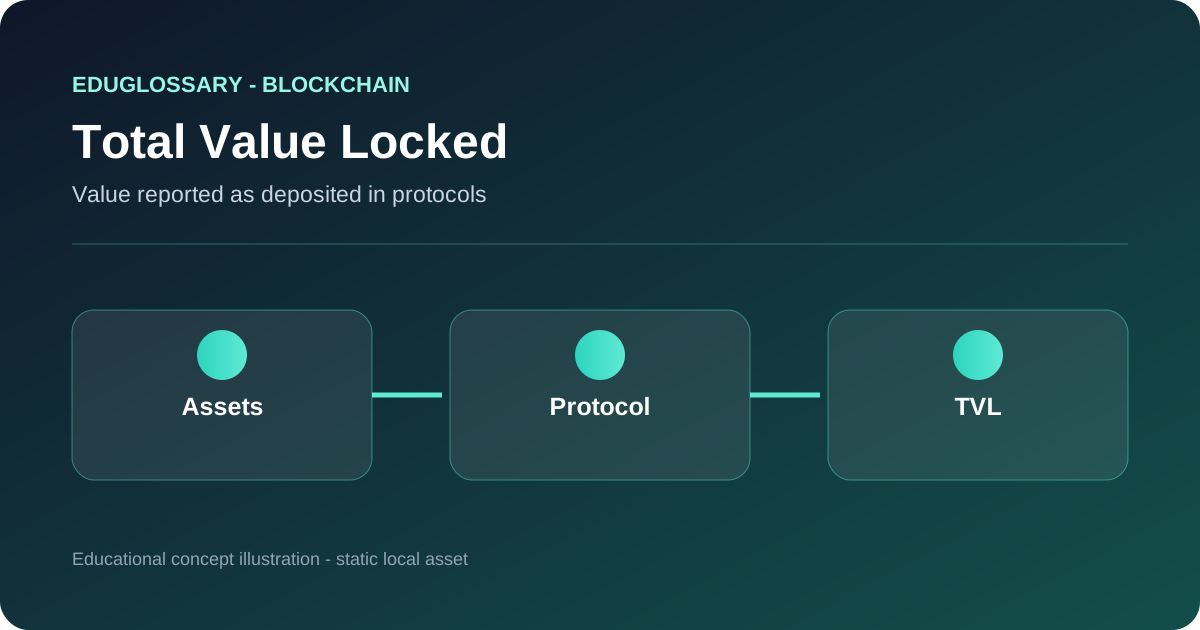
Total Value Locked, usually abbreviated TVL, is a metric used to describe the value of assets counted as deposited in the smart contracts of a decentralized finance protocol or ecosystem. The assets may support lending markets, trading pools, staking-like contracts, vaults, or other applications. Data providers commonly express TVL in a reference currency so that assets with different units can be summarized in one number.
The word locked can be misleading. It does not always mean that funds are subject to a fixed time lock. In many protocols, users can withdraw when the contract rules allow it, provided that liquidity, collateral, and other conditions are available. TVL describes how an analyst classifies contract-held assets; it does not by itself describe a legal claim, a guarantee of liquidity, or the safety of the protocol.
How TVL Is Calculated
A basic calculation identifies token balances associated with a protocol’s contracts, assigns a price to each token, and adds the resulting values. The process sounds simple but requires many methodology decisions:
- Which contract addresses belong to the protocol?
- Which assets count as deposits rather than operational balances or unissued tokens?
- Which price source and timestamp should be used?
- How should bridged, wrapped, staked, borrowed, or receipt tokens be classified?
- How can the same underlying asset be prevented from being counted twice?
DefiLlama, an established open data provider, describes TVL as the value of tokens locked in protocol contracts and documents exclusions such as unissued vesting tokens and certain native staking balances. Other providers may make different decisions. A TVL chart is therefore most useful when its definitions and adapters are understood.
Protocol and Chain TVL
For a protocol, TVL usually refers to assets held in the contracts that implement that protocol. For a blockchain, a dashboard may add the TVL of protocols attributed to that chain. The chain total can include many different applications and may not be directly comparable with one protocol’s figure.
Cross-chain systems require extra care. A bridge can hold assets on one chain that represent value on another, and a protocol can let users move positions between networks. Counting the same economic position on both sides can inflate an aggregate unless the methodology has a specific rule. Receipt tokens can create a similar double-counting problem when a deposit token is deposited again into another contract.
TVL Changes Without New Deposits
TVL is usually valued at current or recent token prices. If the amount of tokens in a contract stays constant but the price falls, the reported TVL falls too. If the price rises, TVL can rise without any new capital entering. Some dashboards therefore separate TVL from inflow, outflow, balance, or net-deposit metrics.
This distinction matters when interpreting activity. A decline in TVL could reflect withdrawals, falling asset prices, a bridge transfer, a contract migration, or a data-label change. A rise could reflect deposits, appreciation, incentives, or the addition of a newly tracked contract. The metric should be read alongside token balances, transaction history, volume, fees, active addresses, and loan data.
What TVL Does Not Measure
TVL is not market capitalization, revenue, trading volume, number of users, or protocol security. A protocol can report high TVL while having low trading activity, concentrated deposits, weak code, or limited immediately available liquidity. Some assets in a contract may be borrowed, volatile, or exposed to the same underlying risk. TVL also does not show whether depositors earned a return or whether the protocol’s governance is trustworthy.
In Decentralized Finance (DeFi), TVL can be a helpful scale indicator, especially when comparing a protocol’s historical footprint under a consistent methodology. It is not a score of quality and should not be used as a standalone basis for a financial decision.
TVL by Protocol Type
TVL can describe different kinds of positions depending on the protocol. In a lending market, it may represent supplied assets that borrowers can use. In an AMM, it often reflects the assets deposited in liquidity pools. In a vault, it can represent assets managed by contract strategies. Staking and liquid-staking systems may require a separate methodology because native staking balances and derivative representations can be counted differently.
Because these structures are not economically identical, a raw TVL ranking can hide important differences. Two protocols with the same reported TVL may have very different liquidity, risk, utilization, and user behavior.
TVL Versus Net Deposits
TVL describes a balance or valuation state, while net deposits focus on changes in contributed capital. Suppose a protocol holds the same number of tokens for a month while the token price rises. Its TVL can increase even though users did not add funds. Conversely, users can deposit additional units while the token price falls enough that the reported TVL barely changes.
This is why historical TVL charts should be interpreted with token price movements and underlying balances. A serious analysis may compare TVL with net flows, protocol revenue, fees, active addresses, trading volume, or outstanding debt.
Double Counting and Dependency Chains
Double counting can occur when one economic position is represented by multiple assets or contracts. A user may deposit a token, receive a receipt token, and then deposit that receipt token elsewhere. A bridge can hold an asset on one chain while a representation circulates on another. If a dashboard counts every representation as independent value, the resulting aggregate can overstate the amount of unique capital.
The same issue appears when protocols are nested inside each other. A protocol’s TVL may include assets that are themselves claims on another protocol. Methodologies differ on whether and how to adjust these dependencies, so aggregated ecosystem figures should always be read with their definitions.
Price Sources and Timing
Most TVL calculations require a token price. Price selection introduces another source of variation. Providers may use different exchanges, market averages, oracle feeds, or update schedules. During volatile conditions, two dashboards can report materially different TVL even when they observe the same contract balances.
A defensible comparison uses the same provider, valuation method, timestamp convention, chain scope, and token classification for every protocol being compared. Mixing figures from incompatible dashboards can produce a ranking that looks precise but is methodologically weak.
A Better Way to Read TVL
TVL is most informative when treated as a contextual scale metric. Ask what assets are included, where they are held, whether users can withdraw them, how concentrated the deposits are, and how much of the balance is exposed to correlated risks. Then compare the figure with usage and flow metrics.
The key question is not simply “How high is TVL?” but “What does this TVL represent, under which methodology, and how has the underlying position changed over time?” That framing turns a headline number into a more useful analytical measure.
A Simple TVL Example
Imagine a lending protocol holding 1,000 units of Token A and 500 units of Token B. If the chosen valuation prices Token A at $2 and Token B at $4, the reported value is $2,000 plus $2,000, for a total TVL of $4,000. If both token prices double while the contract balances remain unchanged, the reported TVL can also double.
This simple example shows why TVL is a valuation snapshot rather than a direct measure of capital inflow. The underlying token quantities and the valuation prices must be considered separately.
TVL and Protocol Incentives
Some protocols distribute tokens or other rewards to attract deposits. Incentive programs can increase TVL even when users are primarily responding to temporary rewards. A rise in TVL during an incentive period does not by itself show that the same amount of long-term economic activity has been created.
Analysts can compare TVL with reward emissions, deposit duration, utilization, fees, and net flows. These additional measures help distinguish organic usage from balances attracted by short-lived incentives.
Why Methodology Comes First
There is no single universal TVL formula for every protocol and dashboard. Contract attribution, token pricing, bridge treatment, receipt-token handling, and staking classification can all change the result. Two dashboards can therefore produce different but internally consistent totals.
For durable educational content, explain the methodology rather than embedding a live TVL figure. Current values belong in dated market or protocol-data content where the provider, timestamp, and definitions can be preserved.
Is TVL the same as assets under management?
It is sometimes used as a rough comparison, but the terms are not identical. TVL counts contract-held cryptoassets under a data methodology, while assets under management usually refers to a regulated or contractual management relationship.
Does high TVL mean withdrawals are always available?
No. Withdrawal ability depends on the contract, pool liquidity, collateral rules, network conditions, and any pauses or restrictions.
Why can TVL differ between dashboards?
Providers can use different contract lists, price sources, token classifications, bridge rules, and double-counting controls. Always check the methodology before comparing figures.
Comparing TVL without double-counting
TVL dashboards can disagree because they use different asset prices, contract lists, inclusion rules, update times, and treatment of borrowed or derivative positions. A protocol may count deposits in a vault while an upstream lending protocol also counts the same collateral, causing aggregate ecosystem totals to exceed unique underlying capital. Cross-chain representations and bridged assets can create similar duplication. Before comparing figures, read the provider methodology and determine whether the measure is protocol-level, chain-level, or intended to represent unique assets.
TVL can increase because an asset’s market price rises even when no new tokens are deposited. It can fall because prices decline, users withdraw, a protocol migrates contracts, or the indexer changes its coverage. When possible, examine token quantities and price effects separately, compare net deposits, and align timestamps. A single USD figure hides these drivers.
Why TVL is not a safety rating
A high TVL can indicate that users have deposited substantial assets, but it does not prove that a protocol’s code is secure, that withdrawals will always work, or that liquidity is available at a fair price. Assets may be concentrated in a small number of wallets, depend on incentives, or be exposed to correlated collateral. Smart-contract exploits and governance failures can affect large and small protocols alike.
A more complete monitoring view
Pair TVL with net flows, utilization, borrow rates, collateral quality, liquidation activity, contract permissions, audit scope, oracle design, and concentration. Separate externally owned deposits from protocol-owned incentives when possible. Identify whether an apparent rise reflects organic usage or a temporary reward campaign, and note any major contract or chain migration.
For research and reporting, include source, timestamp, currency, calculation method, and caveats. TVL is a useful descriptive input when its methodology is understood; it should not be used alone to rank protocol safety, user adoption, revenue quality, or investment value.