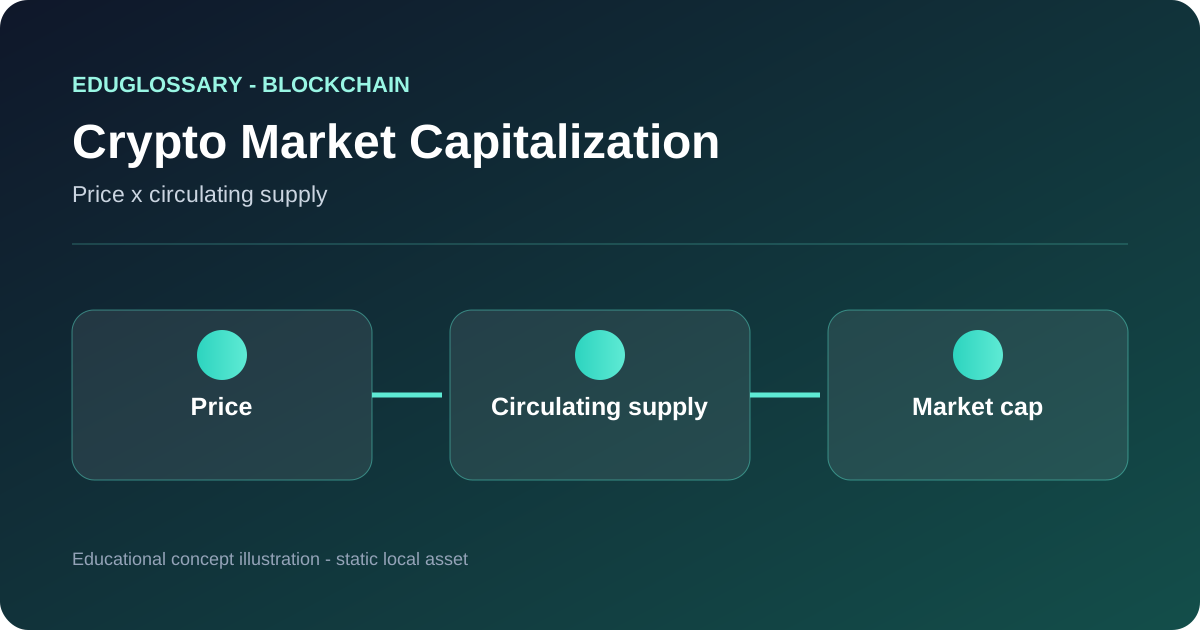
Crypto market capitalization is an estimate of the value assigned by the market to a cryptocurrency or token. The common calculation is:
Market capitalization = current token price x circulating supply
If a token trades at a certain price and the methodology counts a certain number of units as circulating, multiplying those values produces the reported market cap. For the total crypto market, data providers add the market caps of the assets included in their coverage. The result is a measurement convention, not a cash balance held by a project and not a guarantee that every unit could be sold at the quoted price.
Which Supply Is Counted?
Supply definitions are central to the calculation. Circulating supply attempts to count units that are available to the public and usable in the market. Total supply usually describes units that exist, including some that may be locked, reserved, or otherwise unavailable. Maximum supply is a protocol or policy limit, when one exists, on how many units can eventually be created.
A token with future emissions, vesting allocations, treasury holdings, or lost units can have different circulating-supply estimates depending on the data provider’s rules. Wrapped assets, bridged representations, and tokens held by contracts also require classification decisions. A transparent provider should explain what it includes, what it excludes, and how it updates the number.
How Prices Are Collected
The price used in a market-cap calculation is commonly derived from trading venues and aggregated across markets. Data providers may filter out markets with weak liquidity, stale prices, unusual activity, or unreliable reporting. They can also use volume-weighted calculations or other rules to reduce the effect of a single exchange.
Different sources may therefore report different market caps for the same asset. Differences can come from the price timestamp, the list of venues, the definition of circulating supply, the treatment of wrapped or locked units, and the currency conversion rate. A market-cap number should be read together with the provider’s methodology rather than treated as a universal fact with no assumptions.
Market Cap Compared With Other Metrics
Market cap is not the same as trading volume. Volume measures the value of trades during a period, while market cap is a point-in-time estimate of all counted units. An asset can have a large market cap and low available liquidity, or high volume and a much smaller market cap.
Market cap is also different from fully diluted valuation, which multiplies the current price by a larger future or maximum supply estimate. Comparing market cap with fully diluted valuation can show how much supply may still enter circulation, but it does not predict whether the price or supply will stay unchanged.
Total Value Locked (TVL) measures assets counted inside protocol contracts and is therefore not a substitute for a token’s market cap. A protocol token can have a market cap without users depositing it in a DeFi application, and a DeFi protocol can hold assets that are not its own token. On-Chain Data can help verify balances and transfers, but it does not by itself determine the correct market price or classify every address.
Why the Number Has Limits
Market cap assumes that one observed price can be applied to all counted units. In a deep market, that may be a useful summary. In a thin market, selling a large quantity could move the price substantially, so the displayed market cap may be much larger than the cash that could actually be raised. It also does not measure a project’s revenue, security, governance quality, adoption, legal claims, or the value of a service.
Stablecoins introduce another nuance. A stablecoin’s market cap may approximate the number of units in circulation multiplied by its reference price, but the number does not prove the quality or liquidity of reserves. A token’s market cap can also change when supply is minted, burned, unlocked, or reclassified even if its price is unchanged.
Market capitalization is most useful as one standardized way to organize and compare assets under a stated methodology. It should not be used alone to decide whether an asset is cheap, expensive, safe, or suitable for a particular person.
Circulating, Total, and Fully Diluted Supply
Market capitalization depends directly on the supply definition. Circulating market cap generally multiplies the current market price by units considered circulating under a provider’s methodology. Total market capitalization can instead use a broader supply figure, while fully diluted valuation (FDV) commonly applies the current price to a maximum or future supply estimate.
These measures can diverge sharply when a token has large allocations scheduled for future unlocks. A circulating market cap may appear modest because only a portion of units are currently counted, while the same price multiplied by the potential future supply produces a much larger FDV. Neither number predicts what future demand or price will be.
Why Market Cap Is Not the Same as Money Invested
A common misunderstanding is that a market capitalization of a certain size means that the same amount of money has flowed into the asset. Market cap is a valuation measure, not a cumulative capital account. If the latest marginal trade occurs at a higher price, the quoted market cap can rise because that price is applied to many units that did not change hands.
This distinction becomes important in thin markets. A relatively small trade can move the observed price, after which the displayed market cap changes even though the amount traded was much smaller than the new valuation. Market depth and liquidity therefore provide useful context alongside market capitalization.
Data Sources and Methodology
Crypto data providers can differ in exchange coverage, asset mapping, supply estimates, price selection, update frequency, and rules for excluding inactive or inaccessible units. Wrapped assets, bridged tokens, treasury holdings, lost coins, staked balances, and contract-controlled supplies can require special treatment.
When a market-cap figure matters, record the provider, timestamp, asset identifier, and supply methodology. Two figures collected at different times can both be internally correct while no longer matching because the price or supply changed. Cross-provider differences are not automatically errors.
Market-Cap Rankings
Rankings are useful for organizing a large asset universe, but they should not be interpreted as a quality ranking. A high market cap can result from a large supply, a high unit price, or both. It does not establish protocol security, regulatory status, decentralization, revenue, governance quality, or the usefulness of an application.
For research, market cap works best as one dimension in a broader profile. Pair it with circulating supply, liquidity, trading activity, protocol usage, token rights, security history, and the methodology used to derive each metric.
Examples of Market-Cap Changes
Suppose a token has a reported circulating supply of 100 million units and a market price of $2. The simple market-cap calculation is $200 million. If the quoted price rises to $2.50 while supply is unchanged, the reported market cap becomes $250 million. No additional 50 million dollars of cash necessarily entered the market; the calculation simply applies the new marginal price to the counted supply.
The same principle works in reverse. A price decline can reduce market capitalization without a proportional amount of tokens leaving circulation. This is why market cap should not be described as cumulative investment, cash on hand, or the amount of liquidity available for selling.
Market Cap, Liquidity, and Volume
Market capitalization answers a valuation question. Trading volume describes how much reported trading occurred during a selected period. Liquidity describes the ability to execute trades with limited price impact. These measures are related but fundamentally different.
An asset can have a large market capitalization and relatively thin executable liquidity. Another asset can have lower market capitalization but active trading across multiple venues. Analysts should therefore avoid using market-cap rank as a substitute for market-depth analysis.
Why Live Figures Need Timestamps
Crypto prices and supply estimates change continuously. A current market-cap number should therefore include the provider and retrieval time. For a static glossary page, a timeless explanation is generally more useful than a number that becomes stale after publication.
When a current figure is necessary, place it in a dated article, market snapshot, or live data component and preserve the methodology. This keeps evergreen definitions stable while still allowing the site to publish current crypto market information separately.
Does a larger market cap mean a cryptocurrency is safer?
No. It can indicate a larger reported value, but security depends on the protocol, custody, market structure, software, governance, and many other factors.
Why do two websites show different market caps?
They may use different prices, supply estimates, exchange coverage, update times, or inclusion rules. Check each provider’s methodology before comparing numbers.
What is market-cap dominance?
Dominance is an asset’s reported market cap divided by the total market cap of the selected asset set. The result depends on both the asset’s data and the provider’s definition of the total market.
A consistent way to compare market-cap figures
Before comparing two assets or data providers, align the definition of circulating supply, the price source, the timestamp, and the treatment of wrapped or bridged tokens. A market-cap display typically multiplies a quoted price by an estimated circulating supply, but both inputs can differ across providers. Some assets have uncertain unlock schedules, lost coins, treasury holdings, or tokens with restrictions that affect what a source considers circulating. Comparisons are only meaningful when the methodology is understood.
Market capitalization is a mark-to-market estimate, not a statement that the same amount of cash has been invested or can be withdrawn. The last traded price is applied to the supply figure even when only a small fraction of all units traded at that price. Thin liquidity can make the displayed value highly sensitive to a few transactions. A large market cap therefore does not guarantee a deep order book, stable price, low volatility, or low counterparty risk.
Interpreting changes over time
A change can result from price movement, new issuance, a token unlock, a supply reclassification, a change in the provider’s methodology, or a correction to stale data. When supply and price update at different times, a dashboard may show a temporary mismatch. Record the timestamp and source when using figures in a report, and avoid comparing one provider’s live estimate with another provider’s historical snapshot without noting the difference.
Fully diluted valuation attempts to apply a current price to a broader future or maximum supply assumption. It is useful for understanding potential dilution but is not a forecast that all units will be issued or valued at that price. Trading volume measures activity over a period and liquidity describes the ability to trade without excessive price impact; neither is interchangeable with market cap.
A reporting checklist
State the price source, supply definition, calculation time, currency, and any material exclusions. When ranking assets, consider circulating supply alongside liquidity, volume quality, ownership concentration, unlock schedules, contract permissions, and the reliability of the issuer or protocol. Market cap is a descriptive metric, not a safety rating or an investment recommendation.